For UGA Hacks 9, the theme was Superheroes. As stated by UGAHacks, "UGAHacks is an annual 36-hour hackathon event that is centered around software development and innovation in tech. Our hackers will collaborate on software solutions, create prototypes, design innovative projects that exemplify their passion for development, all while building a relationship with the tech community."
My group competed in the HPCC Systems' Help Missing Kids Challenge. We had to, "analyze different social factors such as poverty, unemployment, and other areas to develop possible insights as to why so many are missing and to provide additional first responders and other resource information to the requestor."
Capstone Revamp
For my senior capstone, I was tasked with doing a two portfolio revisions. One of the revisions I chose to do was revamping my HPCC Systems Challenge design from the Hackathon.
The initiatives I set for this project were to:
1) Upgrade the aesthetic
2) Reorganize the navigation bar
3) Update the "Child Missing Risk" meter
4) Having a better explanation for how we calculate risk
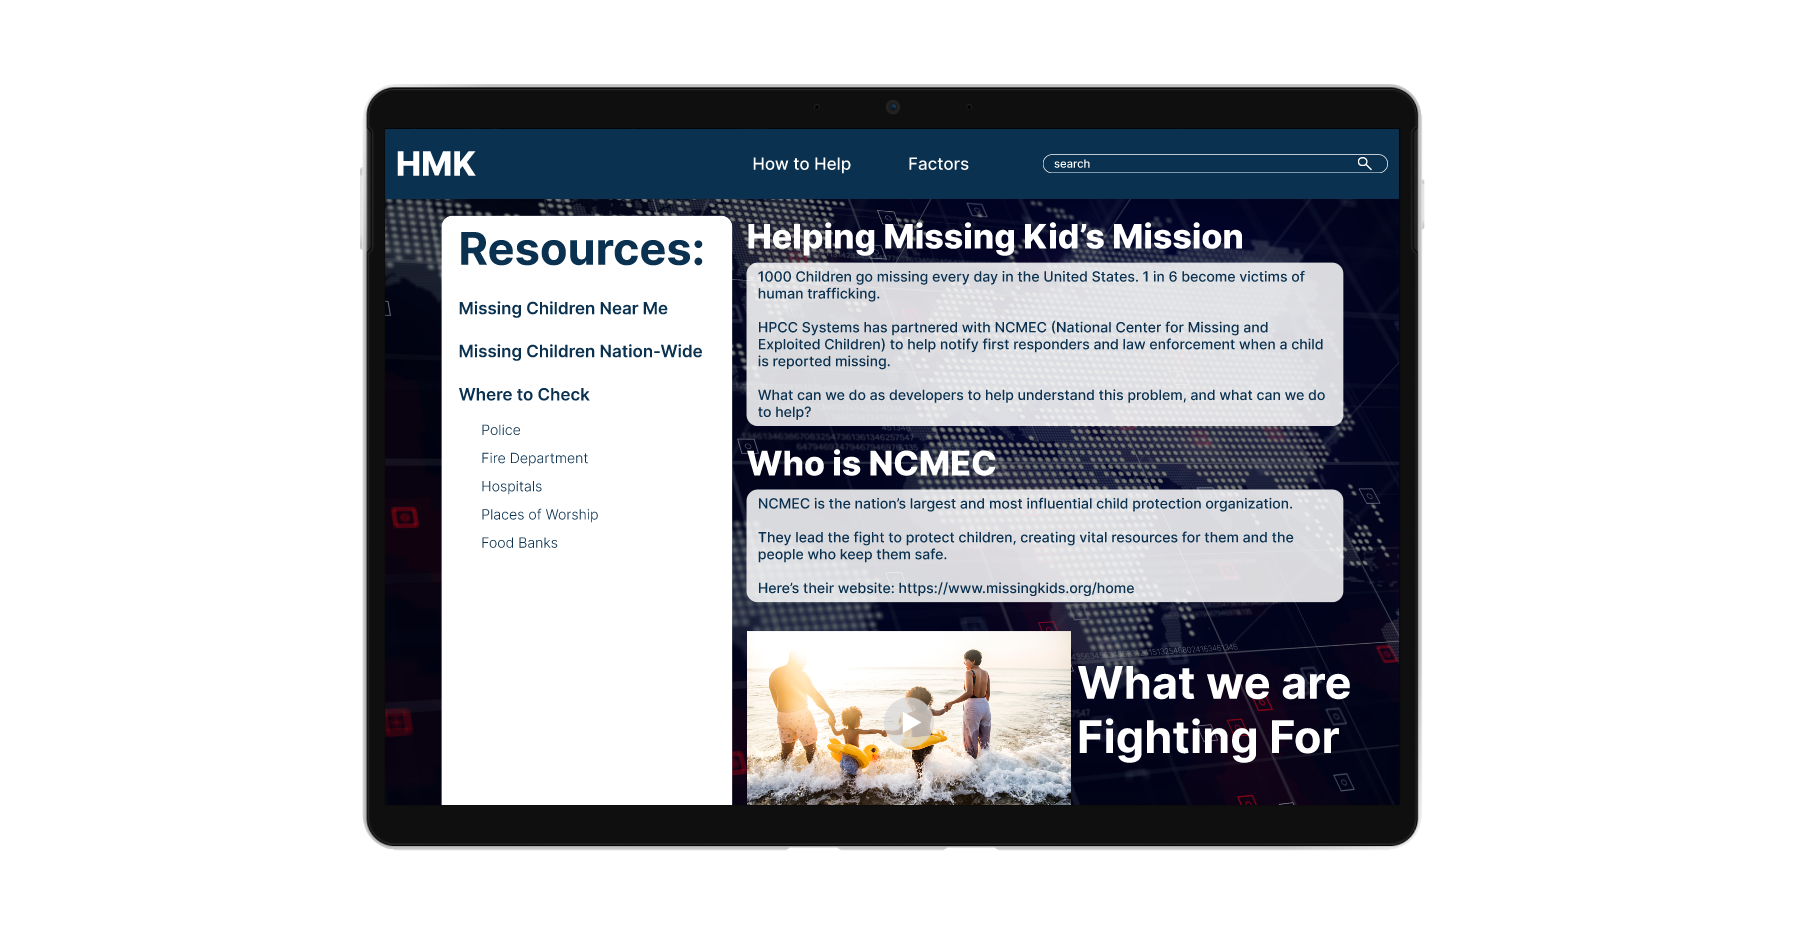
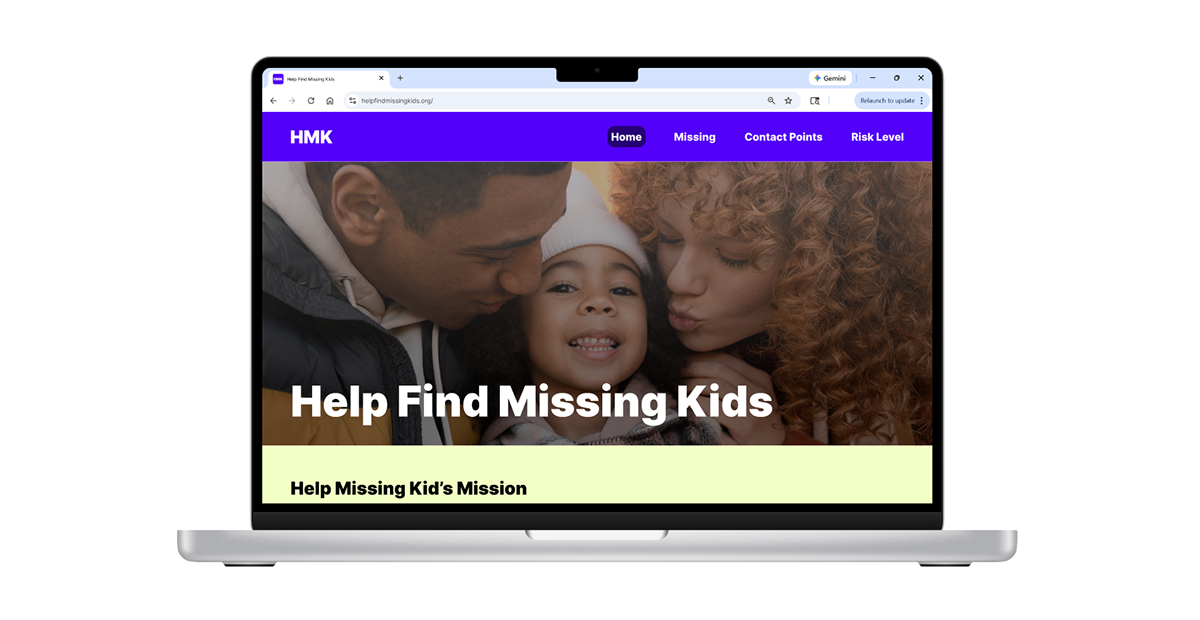
For the revamp, I decided to make the color palette a dark bluish-purple and a light green to make the page a little brighter and add more contrast. Though missing children is not a happy subject, I wanted to make sure the website was bright and reassuring.
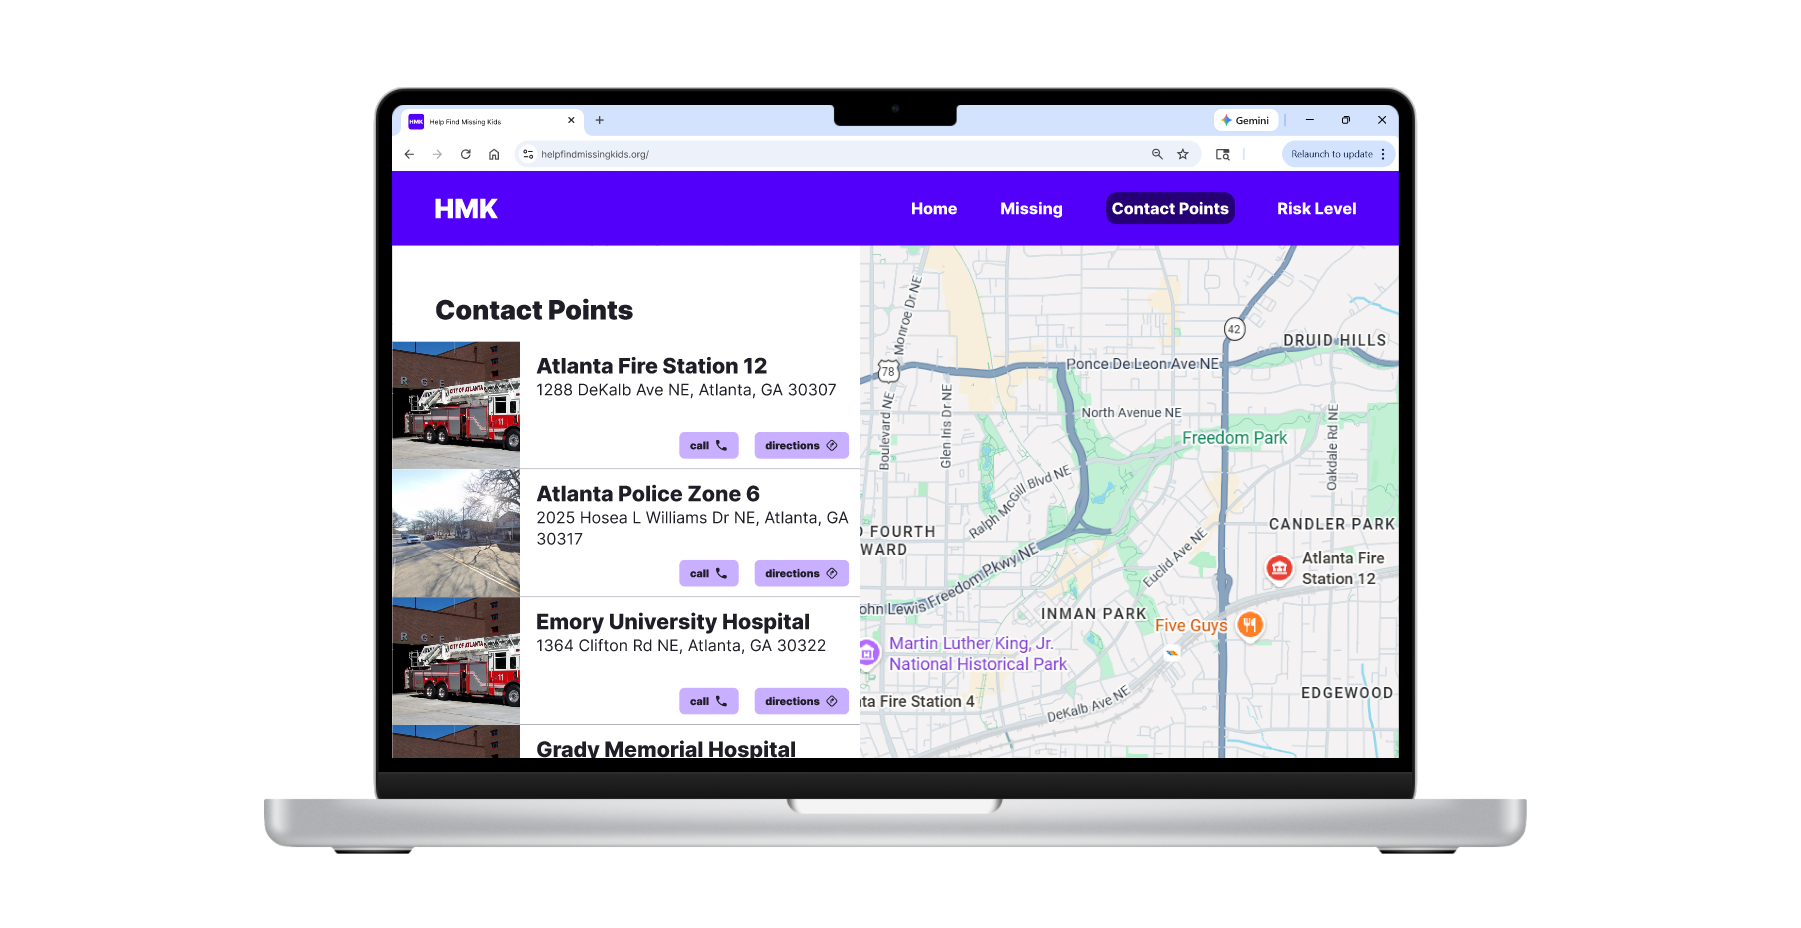
The navigation bar also been rearranged to have all 4 main pages easily accessible and easy to locate where in the site the user is. Additionally, the names of the pages have been changed to better represent what the page is for.
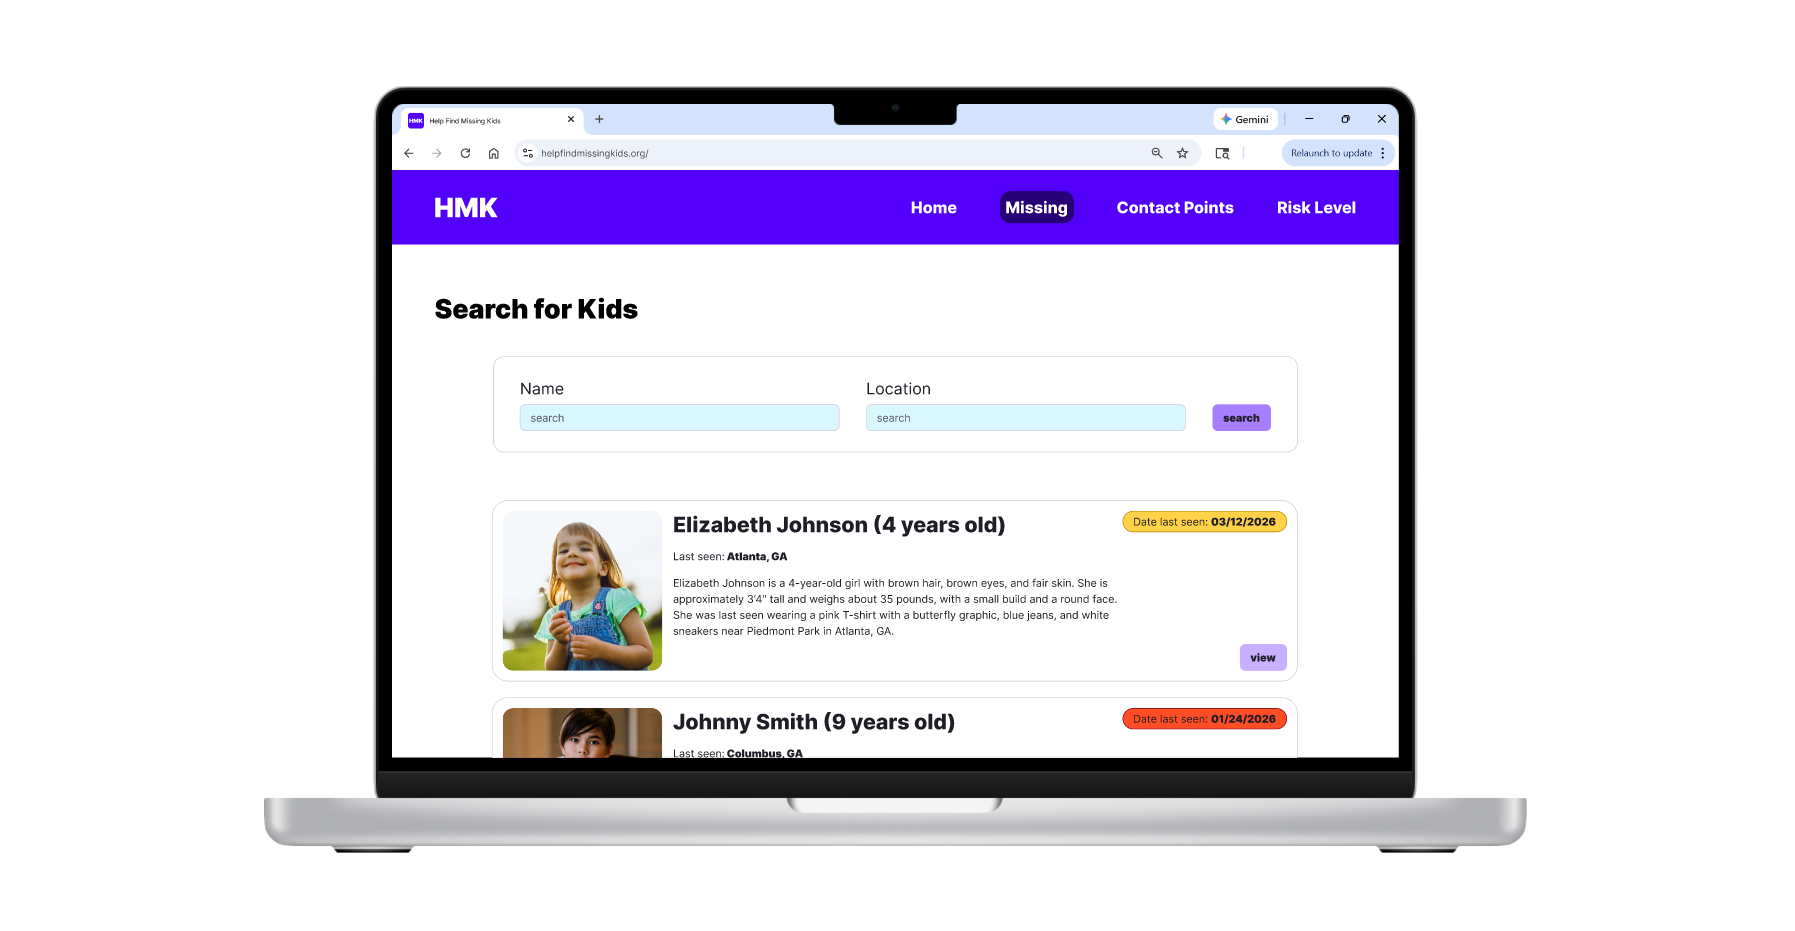
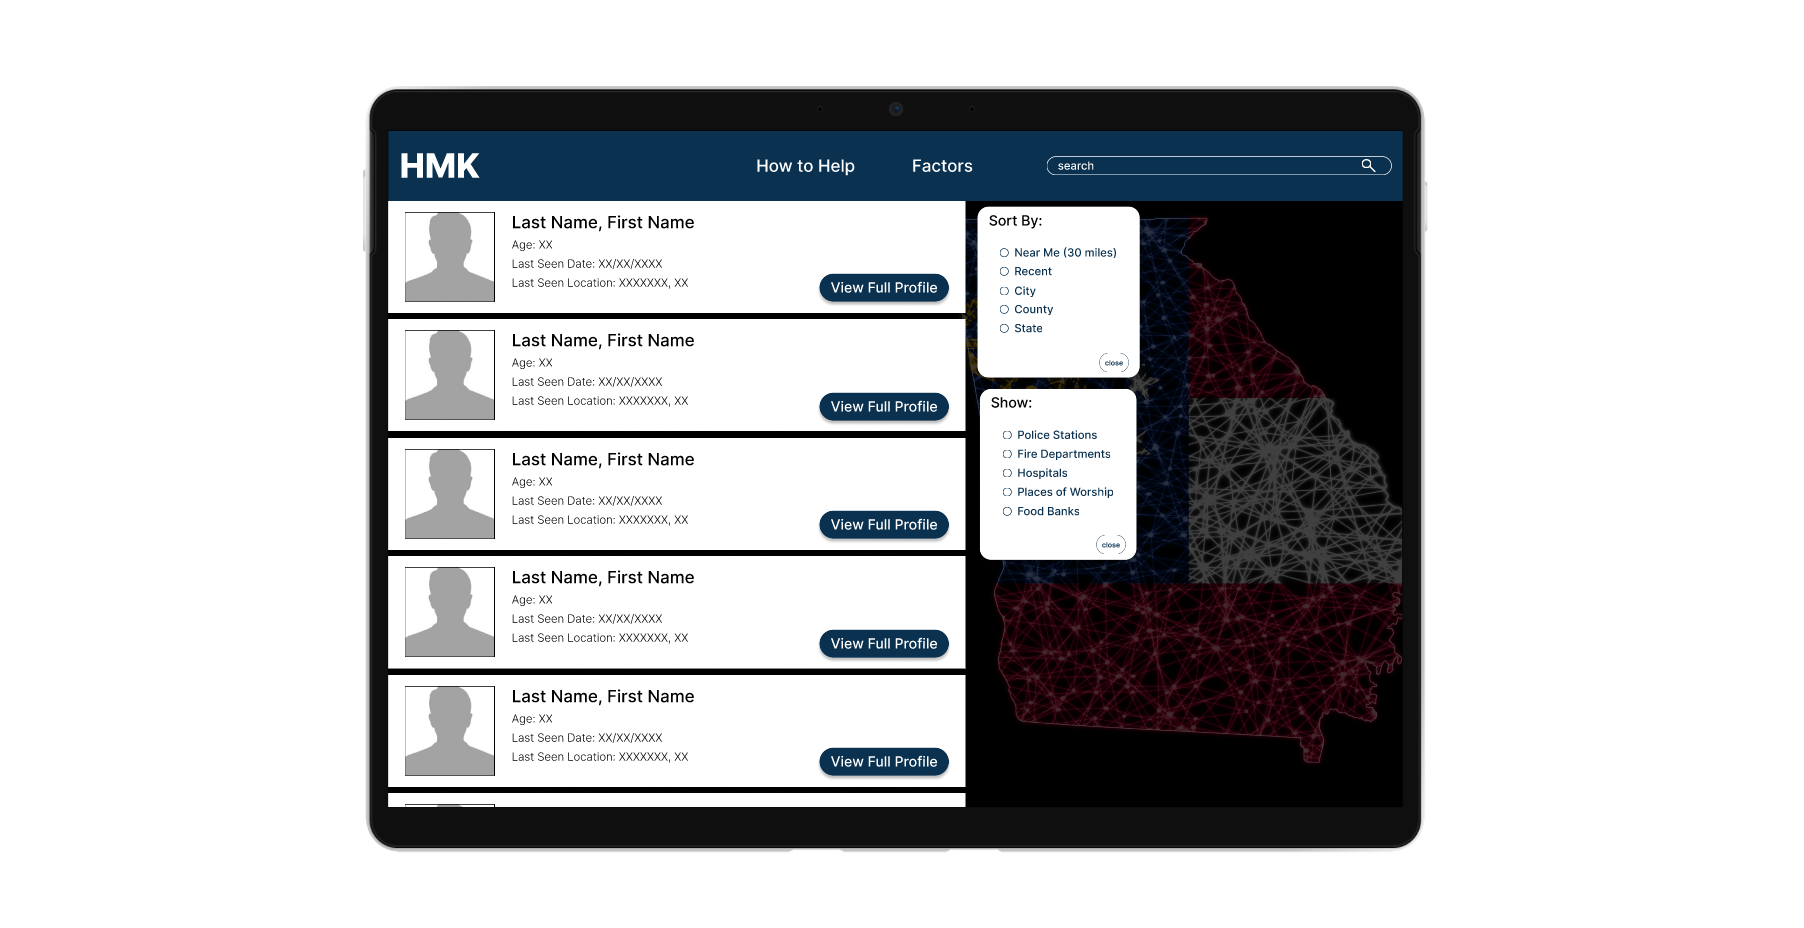
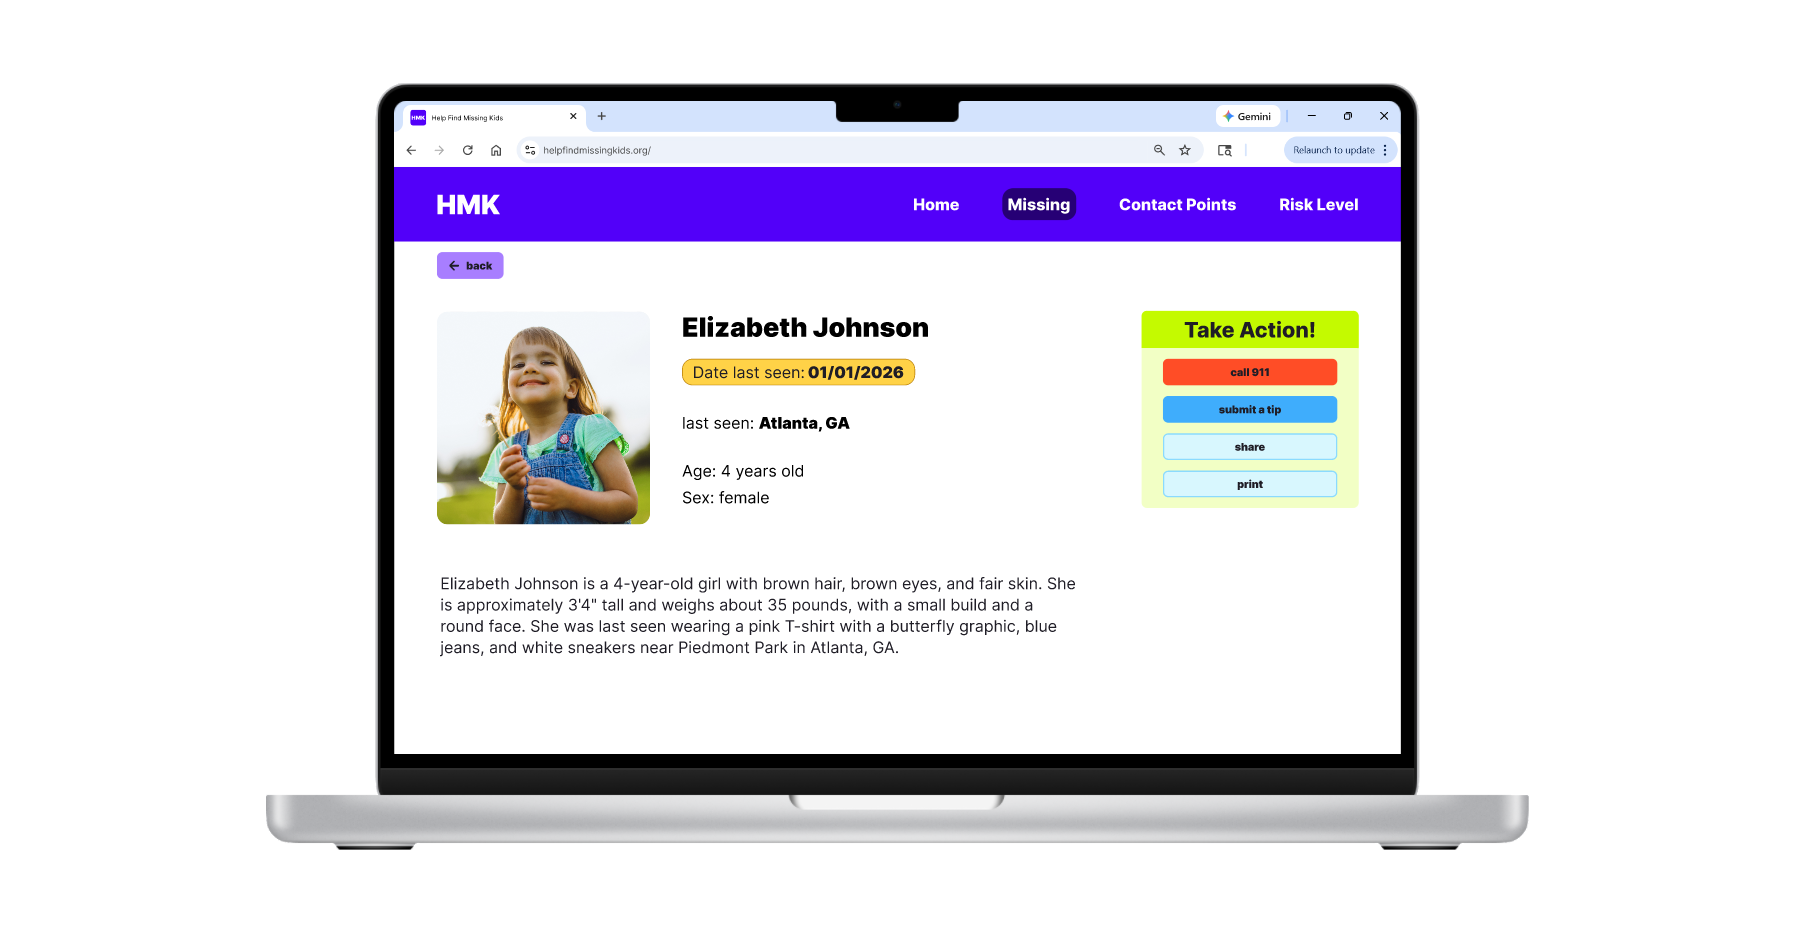
Search: This page is the "Missing" page. It has a list of all of the children missing depending on name or area. By default, it will show the user the missing children from their area.
Date last seen tags: Each child's cover profile has a tag on the right hand side indicating how long they have been missing and how urgent it is. The longer a child is missing, the closer the tag gets to red. (1 - 3 days is yellow, 4-14 days is orange, and 15 or more days is red).
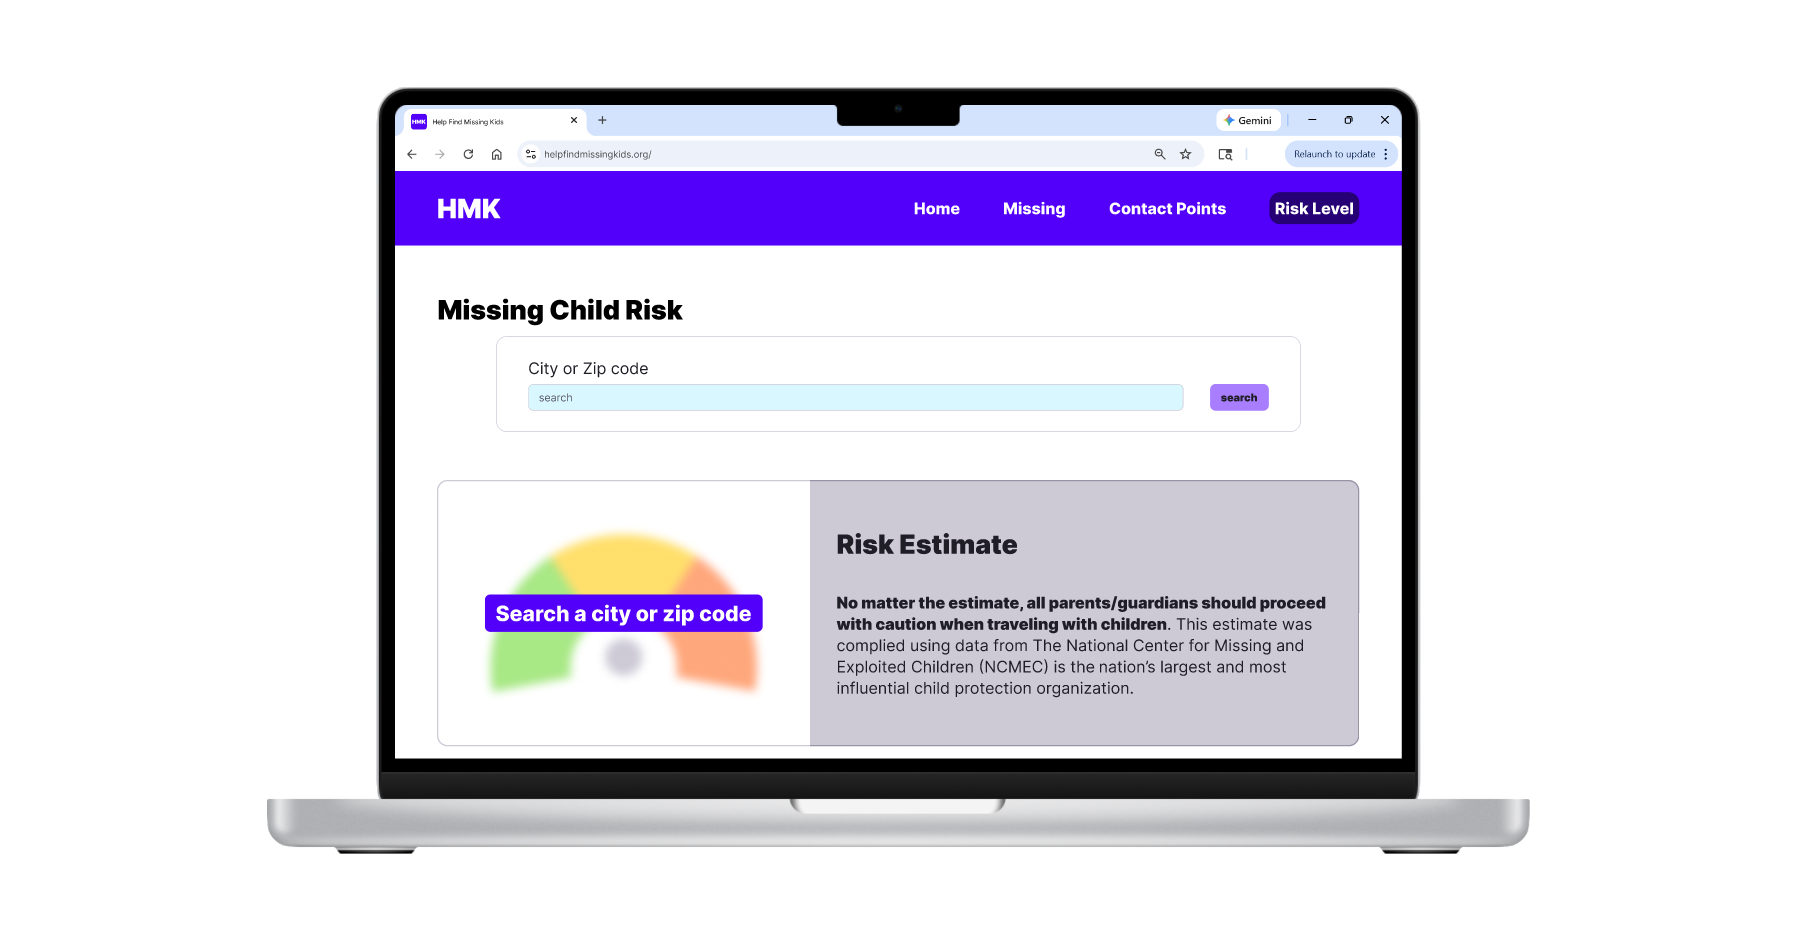
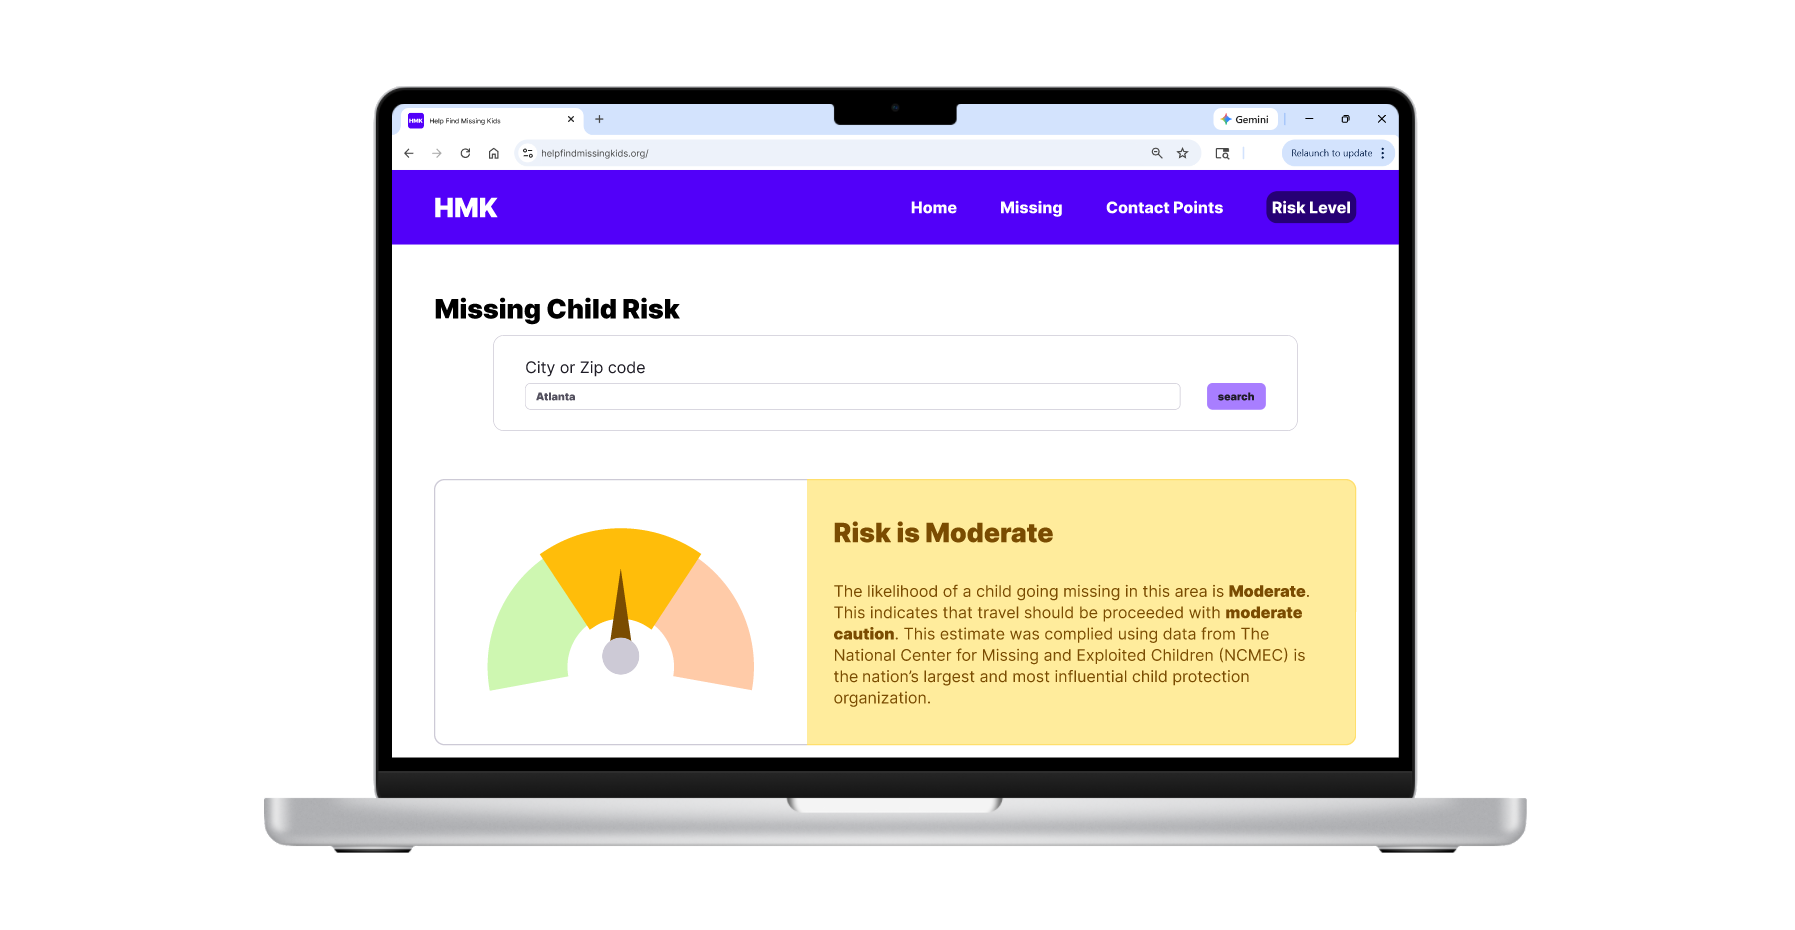
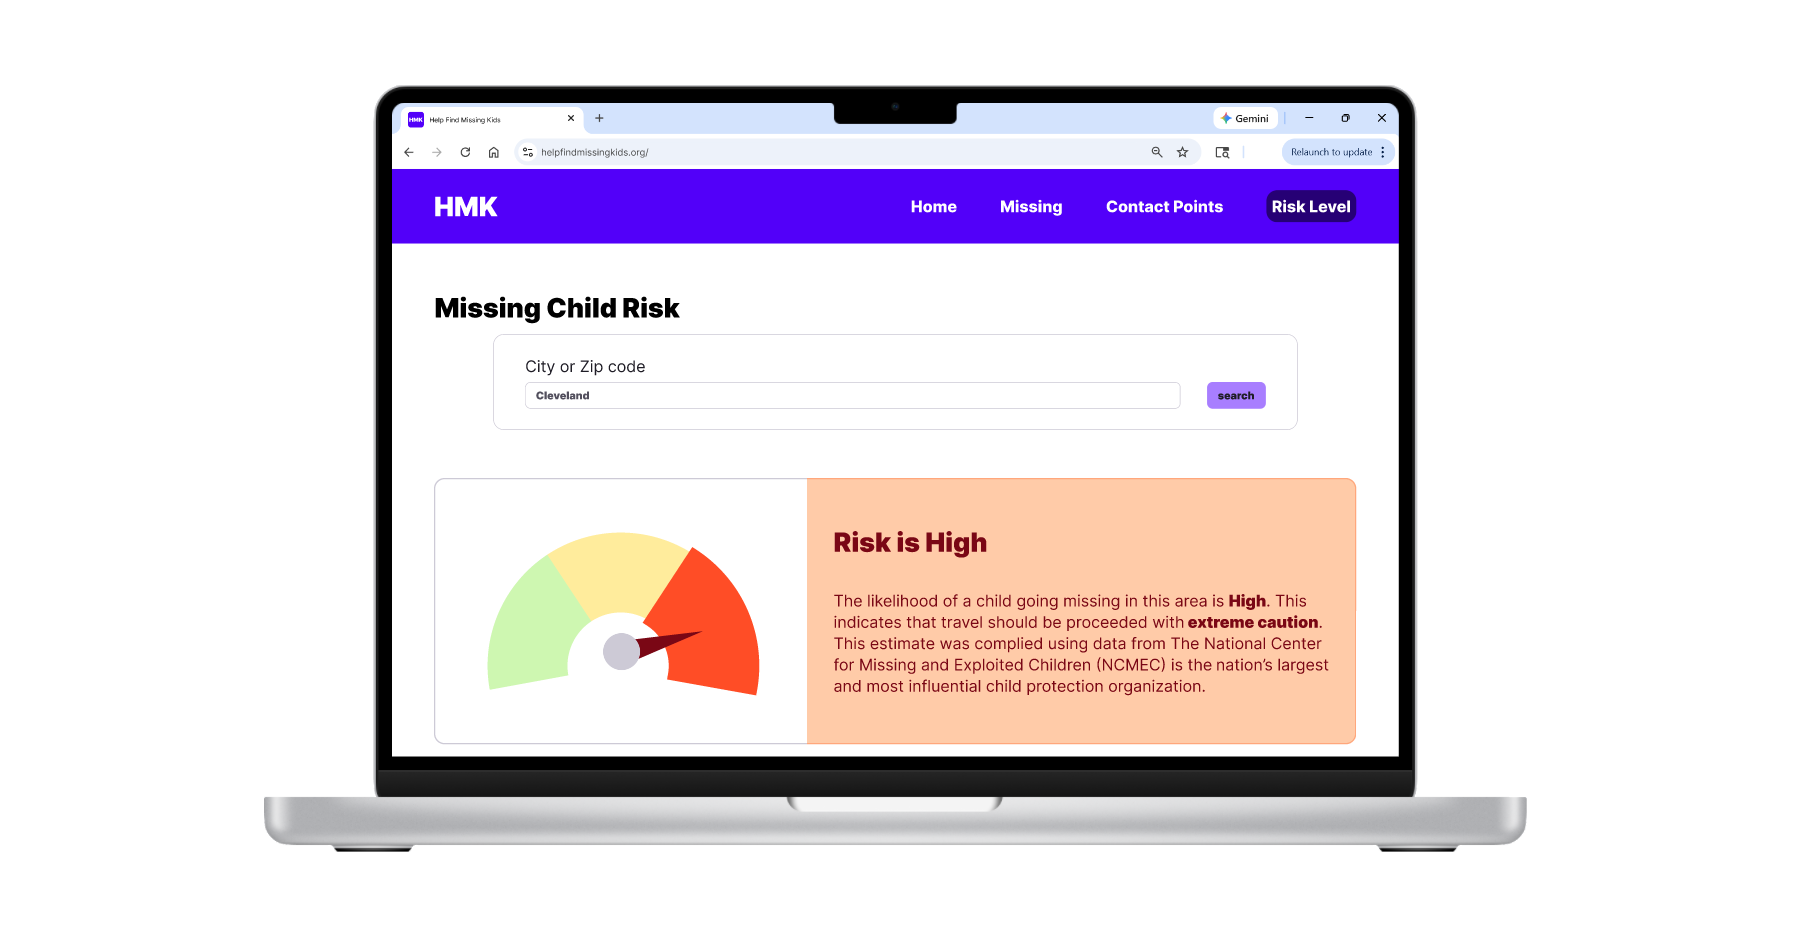
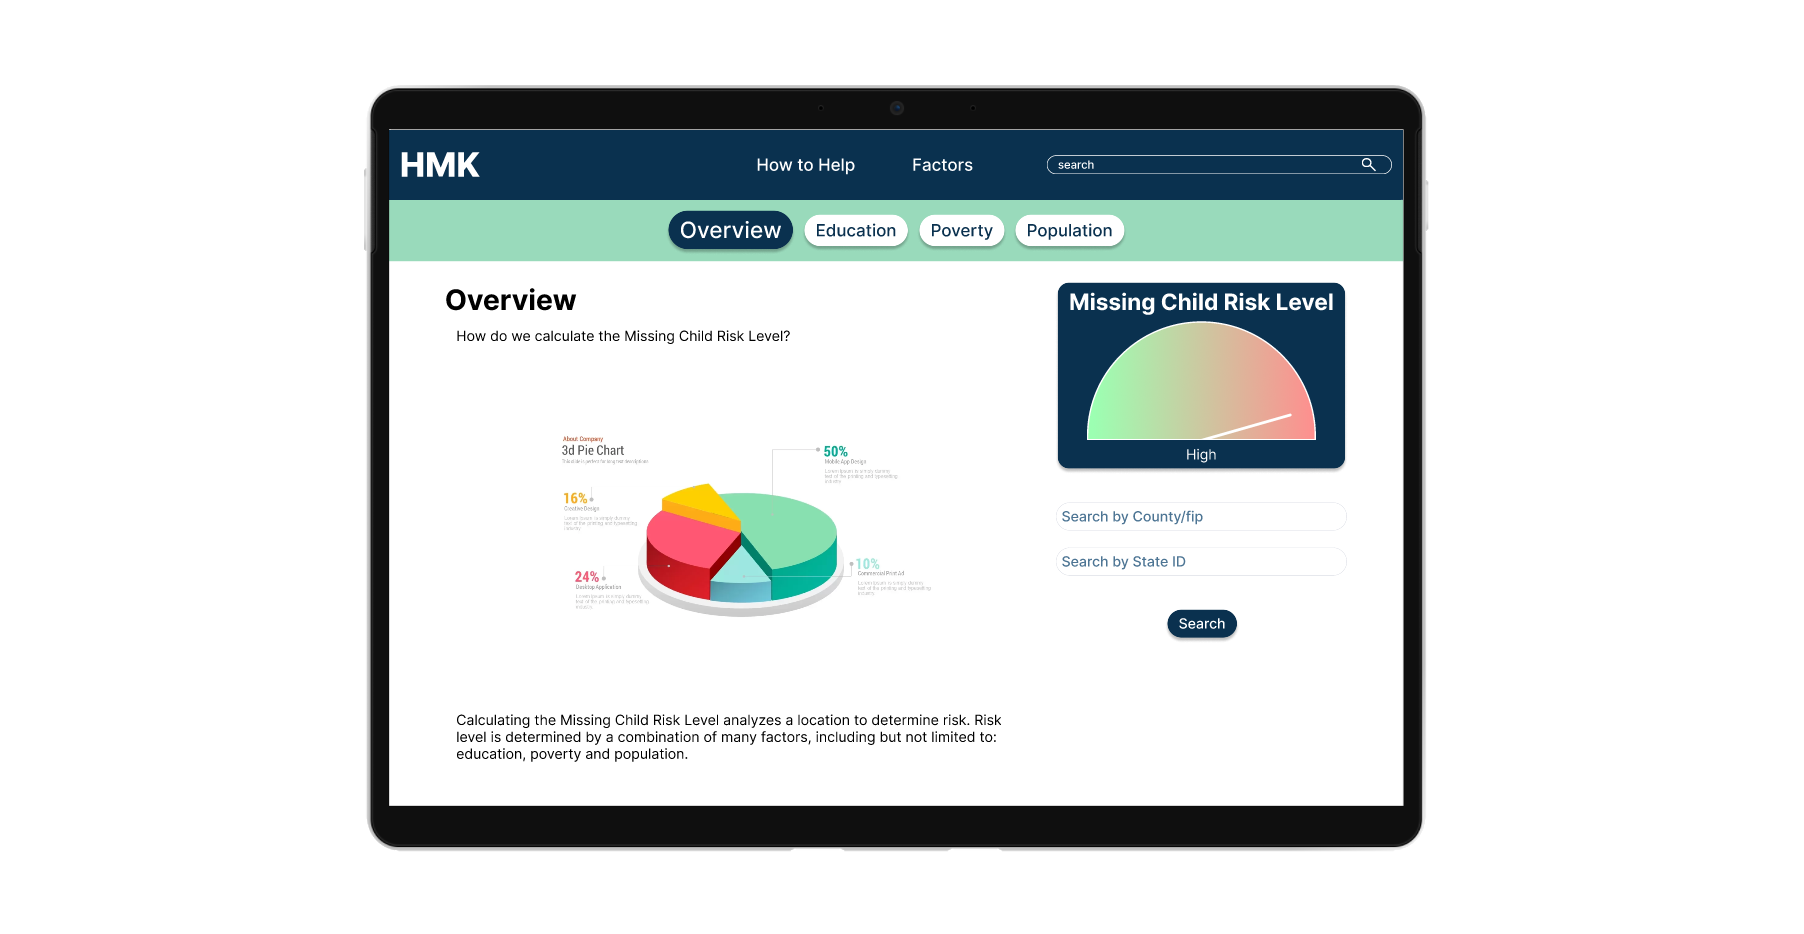
These screens are examples from the "Risk Level Page."
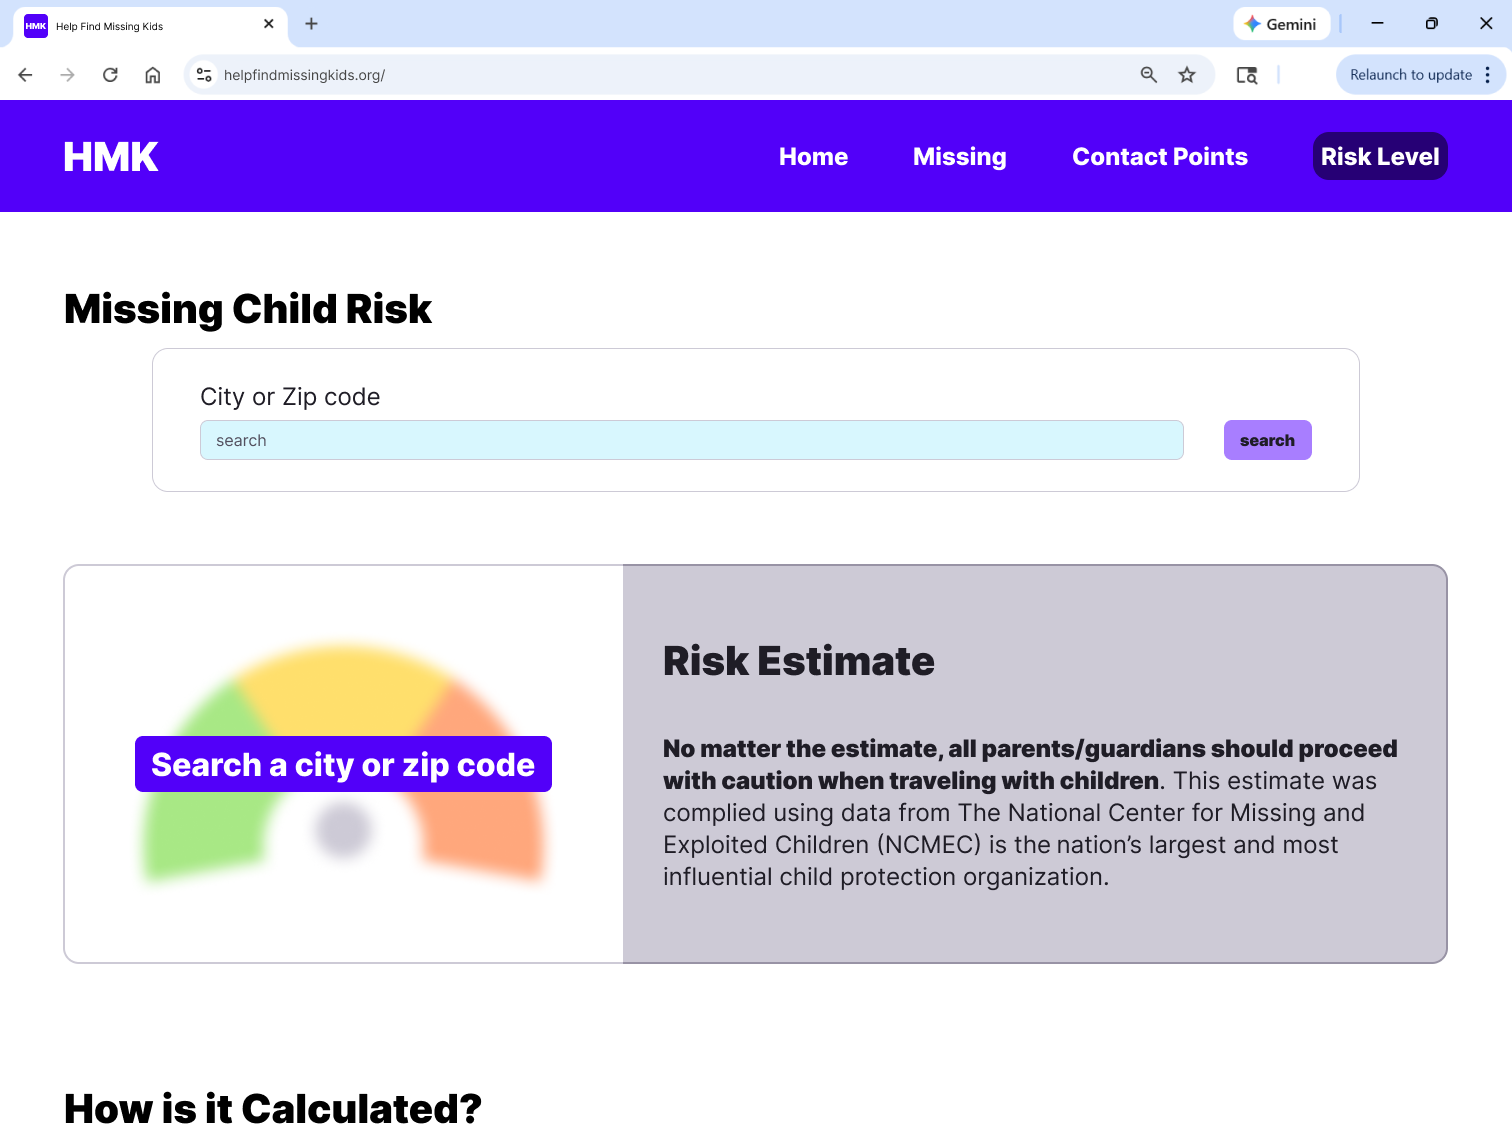
When no location is searched, the meter stays gray, informs the user to input a city or zip code, and informs the user of how the risk is calculated
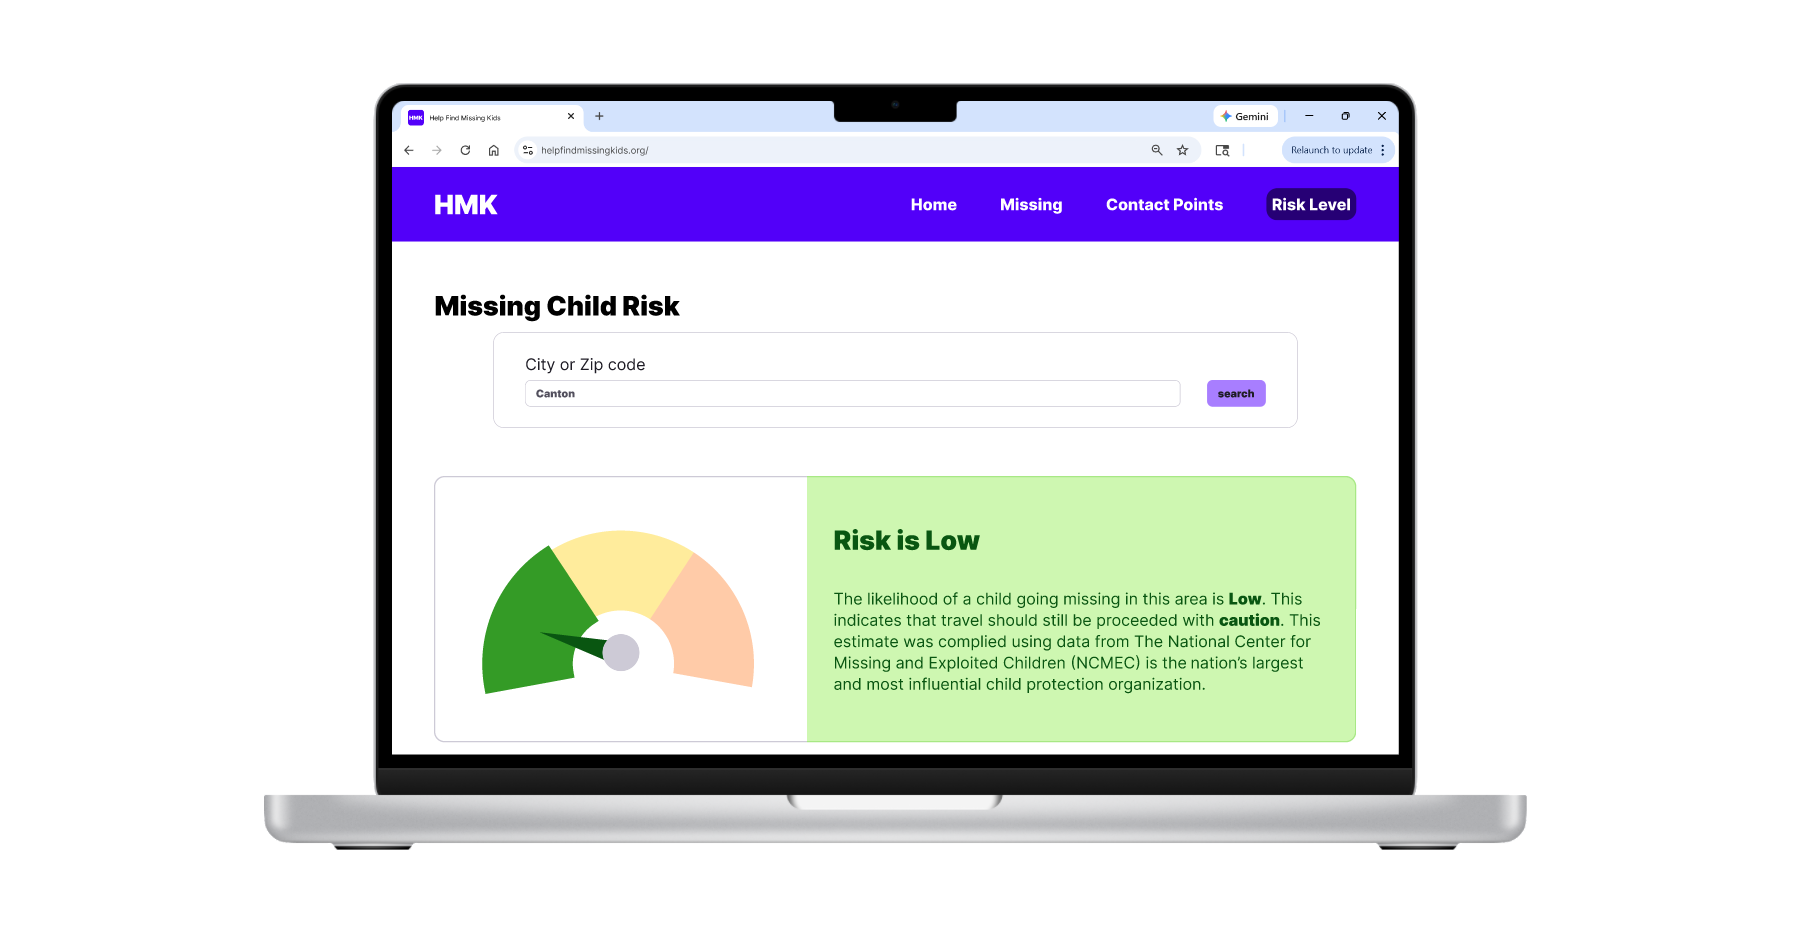
There are 3 different levels for "Missing Child Risk":
1) Low, which is shown in green
2) Moderate, which is shown in yellow
3) High, which is shown in red.
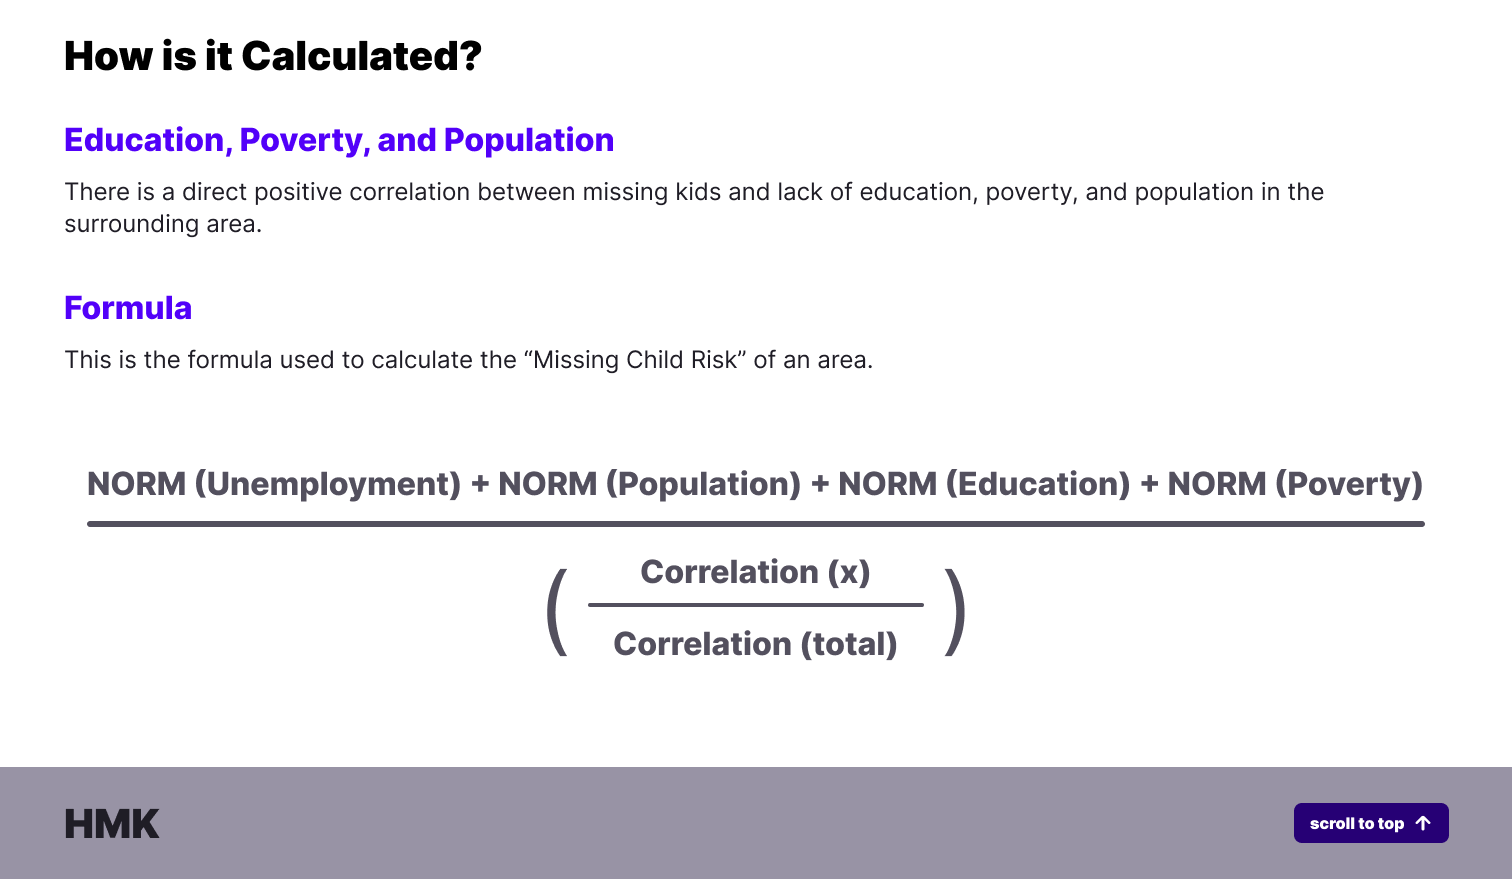
Above is what is displayed when a user scrolls down on the "Risk Level Page" and the corresponding "How is it Calculated" section.
If the user is curious about how the risk is calculated, the data that we pulled and the formula used is available.
Submitted for 2023 Competition (Before Revamp)
As stated previously, I was given 36 hours to complete this project for the UGAHacks Hackathon for the HPCC Systems Challenge. My role in my team was UX designer; however, because my group and I needed time to sift through the data and learn ECL, I only had 12 hours to actually design.
What is ECL?
As stated by HPCC Systems, "ECL - Enterprise Control Language is designed to handle and manipulate immense datasets which make it a perfect language to solve big data problems. ECL can be used for both ETL (Extract, Transform, and Load) and querying data. ECL is a declarative language which allows processing big data without the need of a programmer being involved with details and in-depth imperative decisions."
The programmers on my team went to workshops with HPCC Systems and learned ECL at the event. From what I understand, ECL works a lot like SQL but handles a lot more data.